作者简介:何耀彬(1981-),男(汉族),广东省开平市人.中国科学院深圳先进技术研究院工程师、博士.E-mail:ho.frank@qq.com
中文责编:英 子; 英文责编:雨 辰
1)中国科学院深圳先进技术研究院,深圳 518055; 2)深圳大学计算机与软件学院,深圳 518060; 3)上海公安部第三研究所,上海 201204
He Yaobin1, Zhang Dian2, Qi Li3, Feng Shengzhong1, Ming Zhong2, and Fan Jianping11)Shenzhen Institute of Advanced Technology, Chinese Academy of Sciences, Shenzhen 518055, P.R.China2)College of Computer Science and Software Engineering, Shenzhen University, Shenzhen 518060, P.R.China3)The Third Research Institute of Ministry of Public Security, Shanghai 201204, P.R.China
distributed processing system; parallel computing; data network; queuing network; deployment optimization; load balancing; surveillance networkd
DOI: 10.3724/SP.J.1249.2014.02145
在建设大规模的视频监控网络时,面对监控终端随时传输过来的动态数据流问题,提出一种动态的数据量预测方法和优化设计方案.通过对系统均衡状态的理论分析,建立多层排队网络模型用以分析和预测视频监控网络的视频动态上传行为.基于此模型,对监控网络建设中的两个资源配置问题提出了优化方案.针对满足需求的最少资源配置问题,通过建模给出一种量化计算方法.对因突发事件随机暴增的上传数据流,设计了一种动态调整计算量的算法,可将超出负荷的数据流动态转移到其他可用的计算点,以保持整个系统的负载均衡,保证有效的响应时间.最后,通过一组实际环境下的实验验证了该分析和算法的有效性.
A profound design for a large distributed surveillance network system is proposed in this paper to efficiently quantify and predict the dynamic incoming data flows of video system surveillance. Through making a theoretical analysis on the equilibrium demand of the system, a new queuing network model is introduced to characterize the dynamic video stream uploading behaviors from surveillance network. Two optimization problems in the system are discussed, including minimal server deployment, and dynamic routing for a satisfied quality of service(QoS). Furthermore, the new design and the proposed optimization algorithms are evaluated in a realistic environment. It is able to dynamically redirect the bursty requests flow to the sufficient nodes to avoid the overflow of the queueing and to keep the system response in time.
It is well known that the cameras for surveillance are widely installed for public security,especially in the metropolitan zones.For example,it is reported that Shenzhen in China has equipped 2×10⁵ cameras in 2007[1],and Chongqing in China has launched the plan of installing 5×10⁵ cameras since 2011[2].Therefore,the surveillance videos become an important tool and data source in the field of public security.
However,“how to manage and utilize surveillance data” is a challenge issue for a large surveillance network system.One of the critical reasons is that data sources are widely spread and hard to be predict.Usually,surveillance monitors do not transmit the video data to the manager side.They send the data back when triggered. However,few research so far focus on understanding and exploring how to deploy the sufficient equipment so as to fully exploit the surveillance data.
The paper proposes a large surveillance data system,which is able to manage enormous monitors and computing nodes efficiently.We make a theoretical analysis on the equilibrium demand of the system,introduce a new queueing network model to characterize the dynamic video stream uploading behaviors from surveillance network,and derive the server capacity to optimize its realistic processing. To the best of our knowledge,this paper makes the first attempt to address the issue on how to quantify the dynamic incoming data flows.
Based on the quantitative model,we can optimize configuration of computing nodes to achieve the best application performance at a reduced cost.Furthermore,we will utilize history data records to manipulate the execution environment of computing nodes in the network.We formulate and deal with two optimization problems,which are the minimal server deployment and the dynamic routing for a satisfied QoS(quality of service). We propose an algorithm that can dynamically redirect the bursty requests flow to the sufficient nodes to avoid the overflow of the queueing and keep the system responding in time.Experimental results show that it can dramatically improve the overall performance of our system.
Queueing network is a theory widely applied to many fields,such as processing control,communication,etc.Samari et al[3] describes an analytic model for performance studies of distributed computer networks.The model factors each node of a network into processing and channel components, and models each one separately using M/D/r or M/M/l queues.Recently,queueing network is utilized for enhancing the QoS of video application on the internet.Wu et al[4] leverages Jackson queueing network[5] with infinite-server queues to model the channel churns,though it has an impractical assumption that server resource are unlimited.Kumar et al[6] proposed a simple stochastic fluid model that seeks to expose the fundamental characteristics and limitations of P2P streaming systems.Wu et al[7] put forward a Jackson queueing network model to derive the demand for server capacity in VOD application.Jagannathan et al[8] designed scheduling policies that are robust to busty traffic on a simple queueing network consisting of two links only.Yang et al[9] used Jackson's network theorem to characterize the performance of mobile application servers among different cloud computing environments.Unlike previous research,to the best of our knowledge,our study is the first one to investigate and optimize the surveillance video network by using a queueing network model,which is more challenging than live streaming providing.
As more distributed systems are widely adopted for various applications,recent works trend to investigate work patterns and resource utilization in data centers.These investigations of real workload have revealed a vast of amount of wastage in data centers.Logothetis et al[10] addresses the need for “stateful dataflow” programs that can rapidly sift through huge,evolving data sets and presents a generalized architecture for continuous bulk processing that raises the level of abstraction for building incremental applications.Resource provision is another related topic in this field.Researchers mainly focused on predicating sufficient resource for the quality of service.Most of them are applied in cloud platform or grid networks[11-12].
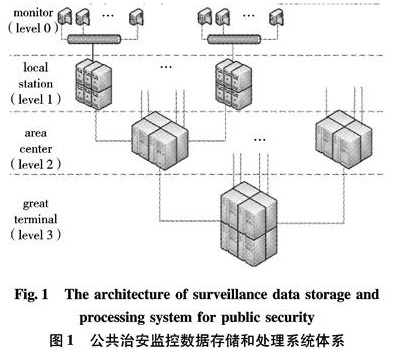
The surveillance data storage and processing system for public security(SDSPS2)can be sketched to be tree-structure distributed system as Fig 1.It consists of 4 layers for now, which are monitor,local station,area center,and great terminal in the bottom-up order.It can be extended to a higher tree structure by inserting more middle layers as the need of the real world grows.Monitor layer is the data source,and other layers are responsible for the data storage and processing.Higher layer nodes are more powerful in capability and performance than the lower ones.We note those nodes of the system in the following order:the great terminal is marked as node T, area centers are noted as node i, i=1,2,…,I, where I is the number of nodes in level 2; local stations under node i are node(i, j), j=1,2,…,Ji, where Ji is the child-nodes number of node i, and the number of monitors is ki, j under node(i, j)correspondingly.
Monitor is the endpoint in our system.Each monitor has a sending buffer to store a short time of video.Nevertheless, it does not always send the video stream to its higher level stations unless by special orders.There are some triggers, in the form of many types, preset in the monitors level:it could be a pressure sensor to indicate a car over the traffic line in the wrong time, or a temperature sensor for fire alarm, or a smart video detector chip integrated in cameras to find out the wanted scenes automatically.Only if incidents fulfill the condition of a trigger, video stream in a certain time slice is pushed to its higher-level station for further analysis and storage.Based on the observation,we may assume that the time slice of each sent video stream has an averaged value T0, and its size could be r0T0, where r0(unit:byte/s)is the standard streaming playback rate.
图1 公共治安监控数据存储和处理系统体系
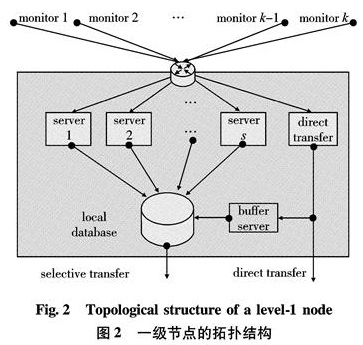
Each local station connects and manages monitors in its territory. Its topological structure is shown in Fig 2.Inside each local station,several servers are deployed to provide service for ongoing video streams.The tasks of those servers are mainly includ:① Storage, they are the interface of local multimedia database for upcoming video streaming.② First-round analysis, they will do the first round analysis, get themeta-data, and build the initial index for each video chuck.
图2 一级节点的拓扑结构Due to the shortage of availability or the low utilization rate,those servers may not have enough capacity to respond all the uploading requests to the same time.Therefore,those requests are buffered as a waiting queueing before they can get the service.
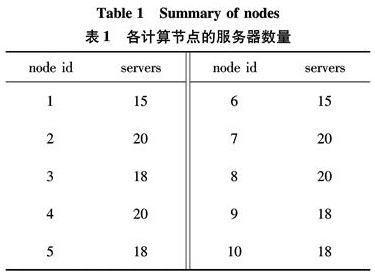
Specially,in local station node(i,j), the number of processed servers for ongoing video streams is noted as si, j. In addition,we can assume that the performance factor of each processing server is averagely equal to Pi, j, which is related to its bandwidth and executing ability(e.g. CPU,I/O).
Furthermore,not all the upcoming videos are processed in this layer.Some of them are directly routed to the higher level nodes due to several reasons,so that the higher node needs to aggregate all live video in its territory to do a comprehensive analysis,etc.For similar reasons,video chucks in storage may be selected and pushed to its upper node for further analysis.As a result,we note these two kinds of uploading are “direct transfer” and “selective transfer”,respectively.
Area center is a powerful processing center built upon lots of local stations. Its structure is similar to that of its child nodes. We can mark the number of its processing servers and the performance factor of each server as si and Pi, i=1,2,…,I, correspondingly.
The great terminal is the most high-performance data center in our system.It can collect and analyze data from all its lower level nodes.It has sT processing servers to deal with upcoming videos, each of which has the performance factor PT.
3 System modeling analysis: a queueing network approach
A Poisson process is a continuous-time stochastic process,which meets the following conditions:① The time between each pair of consecutive events has an exponential distribution with parameter λ, a.k.a. intensity,which is the expected number of events that occur per unit time.② The number of events in different time intervals is independent from each other.From recent research,the Poisson process is considered a good model for web services among many phenomena[13].
From observations,we can safely assume that the external arrival of uploading requests of the video streaming from monitors,or lower level nodes,follows a Poisson process with an average arrival rate of λ(its value may vary in different cases),and the service time of a job in the queue is exponentially distributed.
Considering the case of a level-1 node(i, j), storing and processing videos is regarded as a job in the queue.The arrival and accomplishment of video streams correspond to the job joining the queue and finishing from the queueing,while other important factors in the queueing model,such as service time and waiting time of a job,can mostly find a good mapping to our real system.It has si, j processing servers for incoming video streaming.We can model it as a queue Qi, j with si, j servers and arrival rate λi, j. We can also get its service rate μi, j=Pi, j/(r0T0)and its service time 1/μi, j, where Pi, j is its performance factor and r0T0 is the size of each video chuck.
As the theory of Poisson process,the sub-flows from stochastically splitting a Poisson flow,or the aggregation of multiple Poisson flows,are still Poisson flows, we can safely infer that the arrival to each queue in each node is Poisson process.Meanwhile,a Jackson network[8] is a network of queues where the arrivals at each queue form a Poisson process,and the job service times are exponentially distributed.An open Jackson network is one with external job arrivals into or departures from the system.As a result,we could model our system as the queueing network,which is also an open Jackson queueing network with several M/M/s/∞ queues,the number of which is equal to the number of datacenter nodes in our system.
We will do a detailed analysis of our system via the following network models.
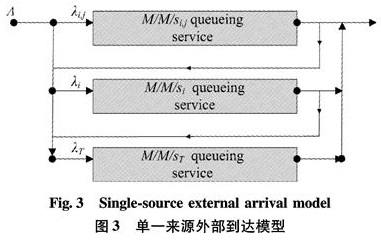
We firstly consider the case that external data source are only from monitors under a single local station,node(i, j). We can build a data model representing this case as Fig 3.
In node(i, j), external arrivals with average arrival rate Λ may join the queue or directly be routed to the higher level node.Let α denote the probability of external arrivals joining the queue in current node.Therefore,for the M/M/si, j/∞ queue Qi, j, we have
{λi, j=αi, jΛ
μi, j=Pi, j/(r0T0)
ρi, j=λi, j/μi, j(1)
where λi, j is the arrival rate,μi, j is the service rate of a single server,Pi, j is its performance factor and r0T0 is the size of each video chuck.To avoid the waiting requests of the queue becoming infinity,we must have enough capability to deal with those requests to keep this system in the stable state.Mapping it into the Jackson network,given the constant factor Pi, j, we must have a sufficient number of processing servers si, j in the queue Qi, j in the equilibrium state,so that the expected sojourn time of each request Ws is no longer than T0, the average time slice of each video streaming.In other words,this condition also means the server utilization ρi, j <si, j.
In the equilibrium of a Jackson network,each of its queue also stays equilibrium, thus we can have the following derivation:
{λi, j=αi, j, 1Λ
λ'i=αi, j, 2Λ+(λi, jβi, j, 1)
λ'T=(1-αi, j, 1-αi, j, 2)Λ+(λi, jβi, j, 2+λ'iβi)
βi, j=βi, j, 1+βi, j, 2<1, βi<1(2)
where λ'i and λ'T is the arrival rate of node i and node T in this single-source case.We note β as the probability of the occurrence of “selective transfer”.Thus βi, j, 1 and βi, j, 2 is the rate of “selective transfer” from node(i, j)to node i and node T respectively,as well as βi for node i to node T.
图3 单一来源外部到达模型Based on the queueing theory and Erlang-C formula[5],we can derive the equilibrium distribution of requests in the queue Q as
{p(0)=[∑s-1n=0(ρ0/n!+ρ2/s!(1-ρs)]-1
p(n)={p(0)·(ρn/n!)n=1,2,…,s
p(0)·ρn/(s!sn-s)n>s
ρs=ρ/s=λ/sμ(3)
where p(n)is the probability of n requests on a stable queue.Then we can infer important factors in a queue,such as c(s, ρ), the probability of waiting occurrence in the queue, and Ls, the exected number of requests in the queue,by the following formulae
c(s, ρ)=∑∞n=sp(n)=(ρs)/(s!(1-ρs))·p(0)(4)
Ls=Lq+Lbusy=
∑∞n=s+s(n-s)p(n)+(∑s-1n=0np(n)+∑∞n=ssp(n))=
c(s, ρ)ρs/(1-ρs)+ρ(5)
In the actual computing,it is necessary to avoid computing a big number such as ρs. Thus,the formula of Lq is transformed as the following when computing
Lq=(ρs)/((1-ρs)2)1/(s!∑s-1n=0(ρn-s)/(n!)+1/(1-ρs))≈(ρs)/((1-ρs)2)1/(1/(1-ρs))=(ρs)/(1-ρs)(6)
In the above subsection,we discuss the single-source external arrival model,where the data flow only from node(i, j)to node i or node T. It is not the case in the real world.In our system,there are Ji level-1 nodes under level-2 node i, i=1,2,…,I, where I is the number of nodes in level 2.It means the model is a tree-like network and the external sources are widely distributed on the level-0 layer.We describe the data flow and process between level-1 and level-2 by Fig 4.
图4 层1和层2的系统模型From Fig 4,we can see there is no difference for the level-1 node(i, j)from the single-source external arrival model,but the arrival data flow of the level-2 node I becomes multifold.Thus,we have to modify the arrival formula of λi. We can find that the arrival flow of node i is the aggregation of multiple flows from its child-nodes node(i, j), j=1,2,…, Ji. Therefore,we have λi=∑Jij=1λ'i. Similarly,the arrival flow of node T is the summary of ones from all its sub-nodes,λT=∑Ii=1∑Jij=1λ'T. As a result,we can derive the arrival rate of different nodes by the following array of formulae:
{λi, j=αi, j, 1Λi, j
λi=∑Jij=1λ'T=∑Jij=1(αi, j, 2Λi, j+λi, jβi, j, 1)
λT=∑Ii=1∑Jij=1λ'T=
∑Ii=1∑JJij=1[(1-αi, j, 1-αi, j, 2)Λi, j+
λi, jβi, j, 2]∑Ii=1λiβi
αi, j=αi, j, 1+αi, j, 2<1,
βi, j, 1<1, βi, j, 2<1, βi<1(7)
where αi, j, 1 and αi, j, 2 are the probability of the external data flows under node(i, j)joining the queue Qi, j and Qi; βi, j, 1 and βi, j, 2 are the rates of “selective transfer” from node(i, j)to node i and to node T respectively,as well as βi for node i to node T.Meanwhile,(1-αi, j, 1)and(1-αi, j, 2)are known as the “transparent rate” of external flow in queue Qi, j and Qi, respectively.In conclusion,the factors of our system with equilibrium can be conducted and inferred by Eq(1),(3)—(5),and(7).
We now discuss how to find an appropriate number of processing servers in each datacenter with reduced investment.According to Little's Law,we have
Ls=λ×Ws(8)
Ws as the average sojourn time.As shown in the above discussion,the expected sojourn time of each request Ws should be no longer than T0 in a queue with equilibrium.Thus,given λ and T0, we can compute the minimal expected number of server s in queue Q, which satisfies the sojourn time and arrival rate condition at the same time.We can firstly get the value of λ by Eq(7),and Ls 0=λT0 by Eq(8),if all other parameters(i.e. α, β, Λ, P)are known.Then we could substitute all known parameters to Eq(5)with condition ρ<s, to derive the minimal value of s:We increase s one by one from an initial value(e.g. [ρ])to get Ls until we satisfy the condition Ls<Ls 0. Therefore, given an expected sojourn time Ws 0, we can perform this optimization to find out the minimal s to suffice requirement
min(s)
s.t.{Ws=Ls/λ=[c(s, ρ)ρs/(1-ρs)+ρ]/λ=
c(s, ρ)/(sμ-λ)+1/μ
Ws<Ws 0
s>ρ(9)
The case we discussed in the above subsection is for normal situation,while its assumption is the arrival rate of λ is invariant. Actually,it is not the case in the real world.Concerning the application of public security,it is a key problem to quickly gather information as much as possible in certain circumstances.It is also one of the most important motivations to build our system. When emergency affairs occur,the requirements of data processing will be greatly increased suddenly.We have to study a mechanism to avoid the traffic bursts.
In the case of requirements booming,we cannot acquire more processing servers instantly in a datacenter.We have to consider taking the advantage of the networking system.In other word,we would increase the transparent rate of arrival data flow for a low-level node to its higher-level datacenter.The impact of manipulating the transparent rate to our network will be discussed below.
At first,we will find out the maximal arrival rate that a queue can afford in a given sojourn time Ws 0 in equilibrium state.It can be derived by the similar way as Eq(9)so that we have
min(λ)
s.t.{Ws=Ls/λ=c(c, ρ)/(sμ-λ)+1/μ
Ws<Ws 0(10)
Thus we can compute the maximal arrival rate for each queue as a constant λ^-.Let Λ' denote the bursty external arrival rate of the system in emergency,we have ΔΛi, j=Λ'i, j-Λi, j^- in the queue Qi, j,where Λi, j^- is the maximal external arrival rate that queue Qi, j can afford with the original joining rate αi, j, 1^-(where Λi, j^-=λi, j^-/αi, j, 1^-). In order to keep the arrival rate no more than λ^- in Qi, j, we have to decrease the joining rate.Therefore,we have
α'i, j, 1Λ'i, j=λ^-=Λi, j^-·αi, j, 1^-
α'i, j, 1=(Λi, j^-/Λ'i, j)·αi, j, 1^-(11)
where αi, j, 1 is the new joining rate of queue Qi, j. The amount of transferred workload is Δλi, j=ΔΛi, j·αi, j, 1^-.
Suggested that all the transferred workload Δλi, j is accepted by the level-2 node i, if it still keeps the arrival rate lower than λi^-,we can simply manipulate the new joining rate α'i, j, 2 by increasing the value of Δαi, j, 1 on the original one.Otherwise, we need to decrease the selective rate βi, j, 1 from node(i, j)temporally until it come to zero.If the data flow or its priority exceeds a guard line,the following strategies are executed depending on situations:① request and route the requests to the level-3 node; ② decrease the arrival rates from other child-nodes..
Based on the discussion above,we setup a smart router in front of each node,which utilizes a dynamic routing algorithm to avoid the overflow of incoming requests.We log down the request arrivals and record the average value for each time interval(e.g. per hours,or other values based on the size of buffering).Thus,we can leverage the arrival patterns in the previous time to predict the stress of the incoming dataflow and dynamic change of the transparent rate of the local node.Another advantage of keeping the arrival log file is that we will study its history trace and do data mining.If the trace is found to be abnormal,a notice or warning will be given to the local node or its higher layer and the dynamic routing strategy may be changed.This design achieves implementation simplicity and has a good practical evaluation in the real world.
The overall system is a huge project,which is still under construction.The workload trace we archived for evaluation is from part of the system, which are 10 nodes under a level-2 node for 30 d.
The system parameters are listed as following.Each level-1 node is connected with several hundred monitors by high-speed fiber channel.The video rate is around 4 Mbit/s.Each time slice of the uploading video is set to 10 s. Thus its size is 4 Mbit/s×10 s=5 Mbyte.The configuration of servers in each node is Intel Xeon Processor E5540,4 Gbyte DDR memory,7 200 r/min SAS hard disk.It can handle average 2 Mbyte video data per second based on experiments.Thus we could have the average service rate μ=P/(r0T0)=2/5=0.4. The number of servers in level-1 for each node are listed Table 1.
表1 各计算节点的服务器数量node id servers node id servers1 15 6 152 20 7 203 18 8 204 20 9 185 18 10 18
The external arrivals are summed up and made an average value Λ(times/s)for each hour in our evaluation for now.The joining rate of queues in level-1 nodes and level-2 nodes are α1=0.95 and α2=0.05 for normal state.After applying the optimization algorithm,to manipulate the joining flow in the next interval we will change their value for each level-1 nodes based on its statistical result of Λ in current interval.As shown above,the guideline of average sojourn time in the queue Ws 0 is set to the time slice of the uploading video,which is equal to 10 s,to keep this system running smooth.Whenever it does not meet this standard within the time interval,we will record it as a “unsatisfied time interval”.The “unsatisfied rate” will be the ratio of “unsatisfied time interval” to the time elapsed for stating the health of the system,which is the lower the better.Fig 5 shows that the improvement of the “unsatisfied rate” of all level-1 nodes after applying the optimization.Those data are collected in 30 days for 720 intervals.We can infer that it would get a better result when the iterative interval is shorter.
图5 一层节点优化后和原始不满意率对比图The external arrivals are summed up and made an average value Λ(unit:times/s)for each hour in our evaluation for now.The joining rate of queues in level-1 nodes and level-2 nodes are α1=0.95 and α2=0.05 for normal state.After applying the optimization algorithm,we will change their value for each level-1 node based on its statistical result of Λ in current interval in order to manipulate the joining flow in the next interval.
Although the number of servers in a certain node is not easy to increase instantly,we can also use the data trace to estimate its optimized number at a reduced cost.The current server number of the level-2 node is 60,while its unsatisfied rate is reduced to 9.7×10⁻³ under optimization.Based on the historical data collected,we can infer the relationship of server number and unsatisfied rate.Fig 6 plots its relationship varying the number of servers from 40 to 100 before and after the optimization.It can both help us to select an appropriate number of servers,and reveal the efficiency of our optimization.
图6 二层节点在不同服务器下的不满意率优化对比图Fig7 reveals that the optimization can further change the distribution of the arrival rate in level-2 node.The level-2 node is more powerful than level-1 nodes in case of emergency,while it may be a relative low utilization rate averagely for a long time.The prediction optimization helps the level-1 nodes to export overloaded flows to the level-2 node.Fig 7 shows that the arrival rate will trend to distribute more equally in lower value zones,and the high arrival rate occurs much less.It proves that the optimization can greatly increase the utilization of the level-2 node and decrease the impact of bursty traffic.
图 7 二层节点优化前后数据到达率分布5 Conclusions
In this paper,we propose a profound design of a large distributed surveillance network system that can be widely applied.We make a theoretical analysis on the equilibrium demand of the system,introduce a new queueing network model to characterize the dynamic video stream uploading behaviors from surveillance network,and derive the required server capacity to support the smooth processing.We then formulate two optimization problems for our system,including minimal server deployment,and dynamic routing for a satisfied QoS.We propose a practical algorithm,which can dynamically redirect the bursty requests flow to the sufficient nodes to avoid the overflow of the queueing and keep the system response in time.With this algorithm and utilizing instantaneous network statistics,the service provider periodically derives the incoming workload in the next interval,makes the decision for its routing strategies,and communicates with its higher layer for overall management.
We verify our analysis and evaluate our algorithm design in a realistic environment.The results show that it can archive a good performance under reduced equipments.
Since the system is still under construction,the future work may come from many fields.For example,we may consider the optimization of the price cost of utility and the distribution of computing servers.Furthermore,it is an important issue for us to archive more data logs from system for further data mining.It would both help the system working more efficient and discovering more interest information for research or for the benefit of civil affairs.
深圳大学学报理工版
JOURNAL OF SHENZHEN UNIVERSITY SCIENCE AND ENGINEERING
(1984年创刊 双月刊)
主 管 深圳大学
主 办 深圳大学
编辑出版 深圳大学学报理工版编辑部
主 编 阮双琛
国内发行 深圳市邮电局
国外发行 中国国际图书贸易集团有限公司(北京399信箱)
地 址 北京东黄城根北街16号
邮 编 100717
电 话 0755-26732266
0755-26538306
Email journal@szu.edu.cn
标准刊号 ISSN 1000-2618
CN 44-1401/N