2.1 Raman spectrum of PET fibers
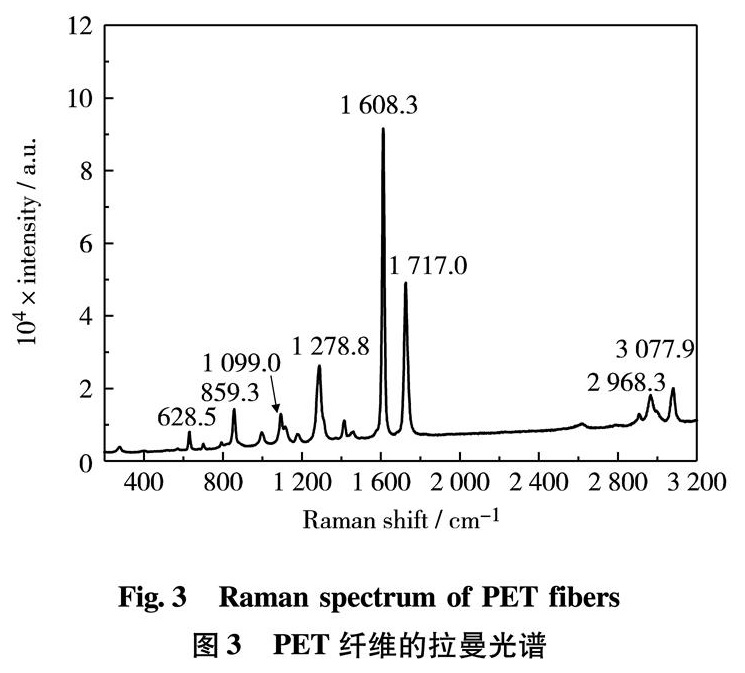
First of all, the Raman spectrum was obtained for PET fibers without any processing, as shown in Fig.3. The main peak is located at 1 608.3 cm-1, corresponding to the Raman scattering by benzene rings in PET[13]. Raman peaks appear in the range 200—3 250 cm-1, and the Raman frequency shifts of different peaks in order of increasing frequency are 628.5, 859.3, 1 099.0, 1 278.8, 1 608.3, 1 717.0, 2 968.3 and 3 077.9 cm-1. The highest five peaks, located at 1 608.3, 1 717.0, 1 278.8, 2 968.3, and 3 077.9 cm-1, are referred to as the main peak and secondary peak 1, secondary peak 2, secondary peak 3 and secondary peak 4, respectively. The absorption peaks below 900 cm-1 are produced by bending vibration of C—H with isolated adjacent hydrogen and hydrogen bond on the benzene ring[14]. The Raman peak at 1 717.0 cm-1 is generated by carbonyl, with large intensity and a sharp shape[15]. The peak at 1 099.0 cm-1 corresponds to C—O—C of anti-symmetric stretching vibration[16]. The Raman peak at 3 077.9 cm-1 results from the stretching vibration peak of the unsaturated C—H bond on the benzene ring[17]. The dyeing process of PET fibers can introduce fluorescent substances into PET fibers, such as fluorescent whitening agent and fluorescent dye, giving rise to a strong fluorescence background which covers some of the characteristic peaks in Raman spectrum of PET fibers.
Fig.3 Raman spectrum of PET fibers
图3 PET纤维的拉曼光谱
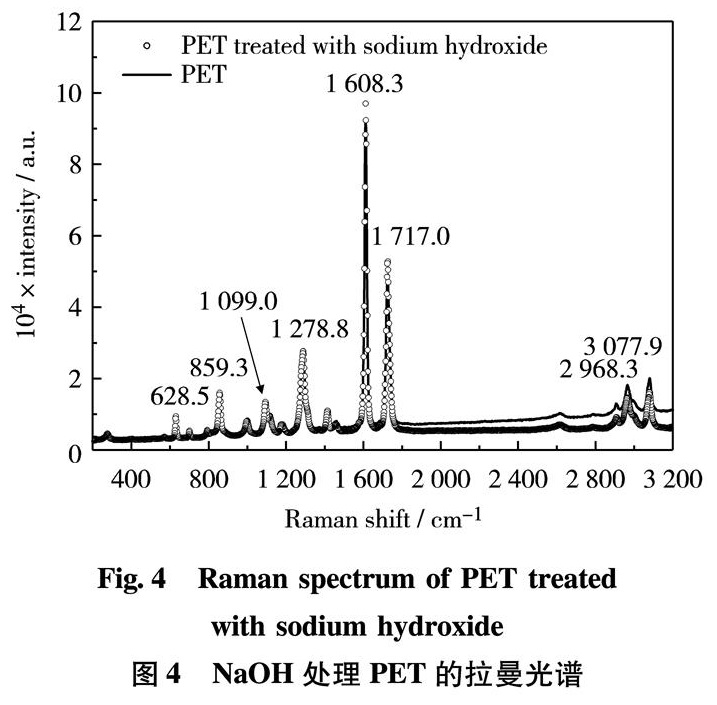
The Raman spectrum of PET fibers treated with sodium hydroxide was acquired experimentally, as shown in Fig.4, in which two distinct features appear. Comparing Fig.4 with Fig.3, it is clear that within the range of 200—1 750 cm-1, the intensities of Raman peaks of PET fibers treated with sodium hydroxide become higher compared to those the untreated PET fibers. Specifically, the intensities of Raman peaks at 628.5, 859.3, 1 099.0, 1 278.8, 1 608.3 and 1 717.0 cm-1 increase by 24%, 15%, 12%, 11%, 8%and 13%, respectively. The intensity increment of Raman peaks is mainly attributed to the increase of the surface roughness of the PET treated with sodium hydroxide. When the PET is treated with sodium hydroxide, its actual area will increase, and the number of molecules involved in the Raman process will increase. Beyond 1 750 cm-1, the intensities of Raman peaks of PET fibers treated with sodium hydroxide are commensurate with those of untreated PET fibers, except that the fluorescence background decreases to a certain extent.
Fig.4 Raman spectrum of PET treated with sodium hydroxide
图4 NaOH处理PET的拉曼光谱
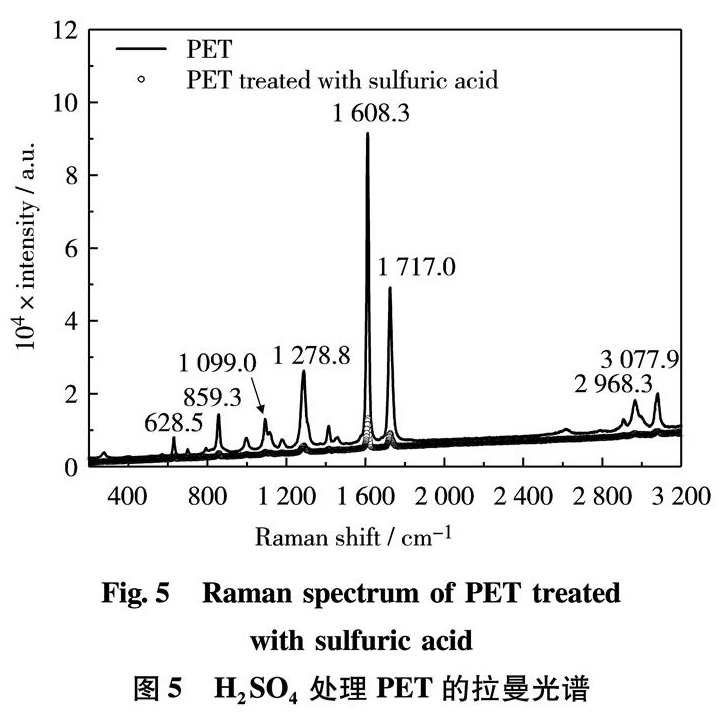
To gain an insight into the influences of sulfuric acid on chemical bonds and molecular structures of PET fibers, we treated them with sulfuric acid, and the Raman spectrum was obtained experimentally, as shown in Fig.5. It shows from Fig.5 that the intensities of Raman peaks of PET fibers treated with sulfuric acid decrease remarkably compared to those of the untreated PET fibers. Specifically, the intensities of Raman peaks at 628.5, 1 278.8, 1 608.3 and 1 717.0 cm-1 decrease by 90%, 92%, 91% and 91%, respectively. Whereas, Raman peaks at 859.3, 1 099, 2 968.3 and 3 077.9 cm-1, have almost entirely disappeared, implying that C—O—C anti-symmetric stretching vibration mode of PET macromolecular chain, CH2 on C—H stretching vibration mode and unsaturated C—H on the benzene ring are completely inhibited. In the meantime, the fluorescence background decreases owing to the interaction of sulfuric acid with fluorescent substances of PET fibers.
Fig.5 Raman spectrum of PET treated with sulfuric acid
图5 H
2SO
4处理PET的拉曼光谱
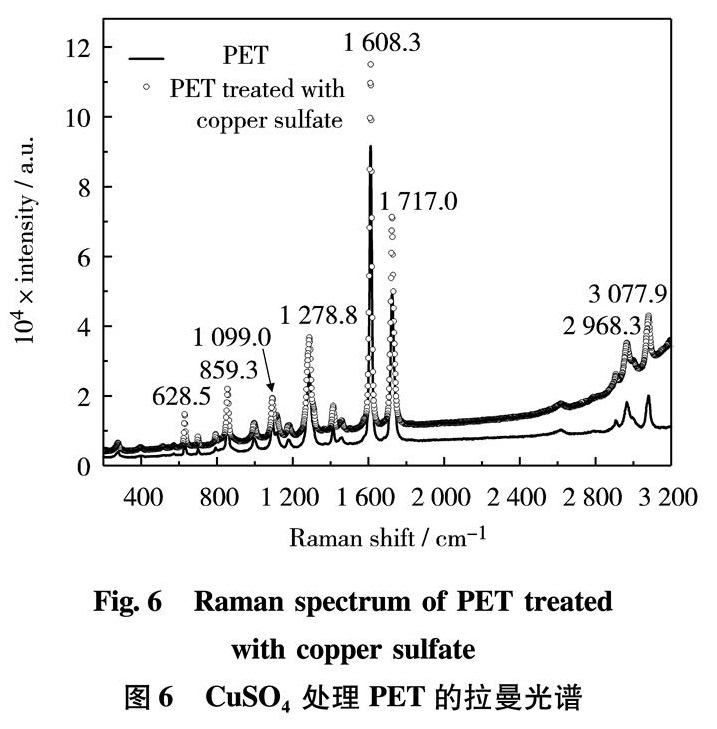
Using the same procedure, Raman spectrum of PET fibers treated with copper sulfate was obtained as well, as shown in Fig.6. One can see that the intensities of Raman peaks of PET fibers treated with copper sulfate increase significantly, suggesting that the surface roughness of the PET increases after being treated with copper sulfate. Specifically, the intensities of Raman peaks at 628.5, 859.3, 1 099.0, 1 278.8, 1 608.3, 1 717.0, 2 968.3 and 3 077.9 cm-1 increase by 88%, 51%, 45%, 33%, 22%, 43%, 56% and 65%, respectively.
Fig.6 Raman spectrum of PET treated with copper sulfate
图6 CuSO
4处理PET的拉曼光谱
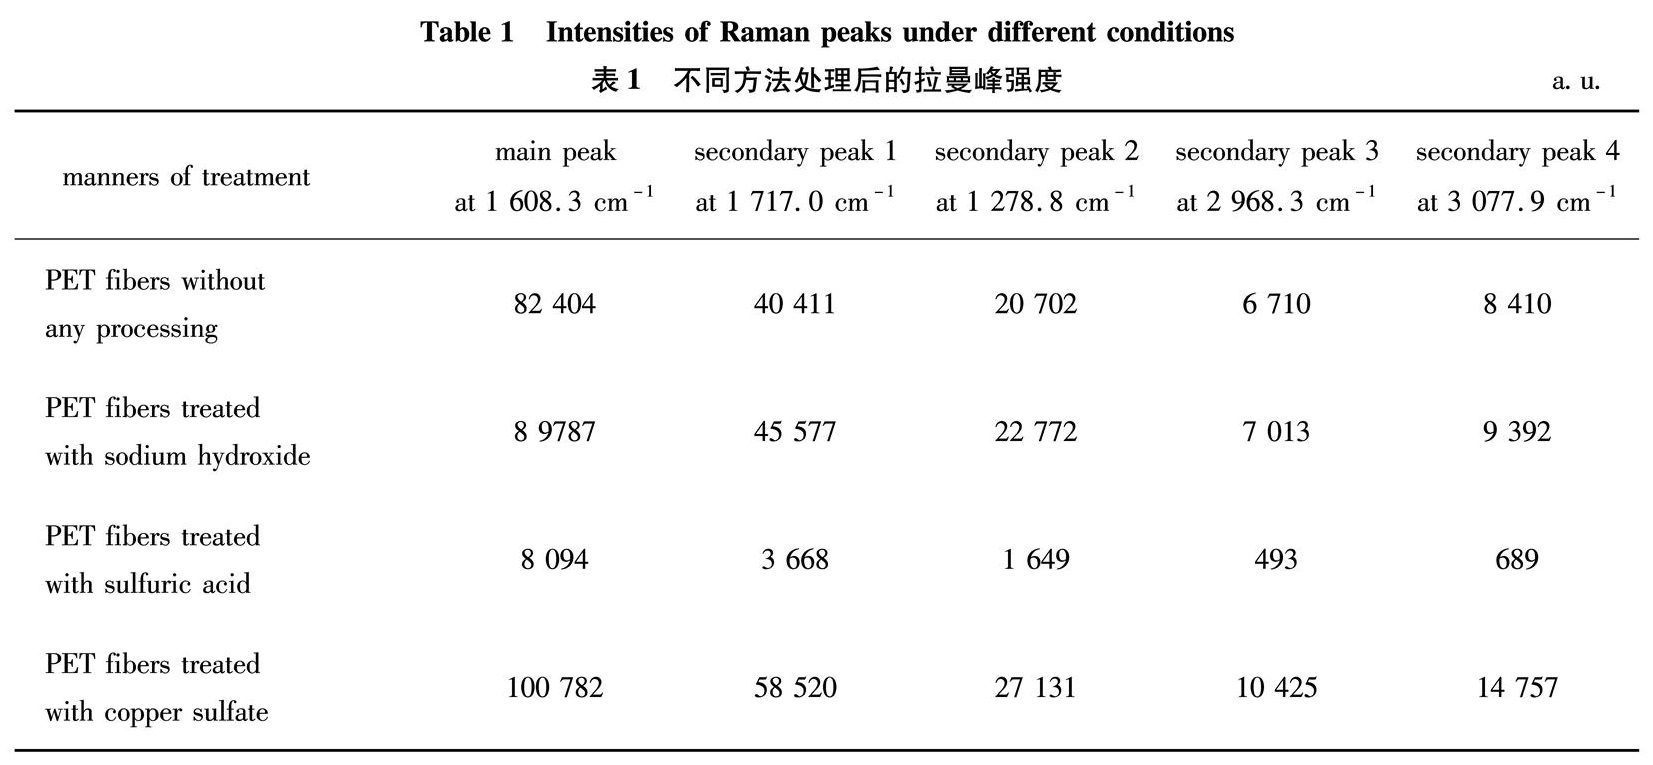
Further insight into the influences of chemical solvents on the chemical bonds and molecular structures of PET fibers can be achieved by comparing the relative intensity of main peak and secondary peaks. Table 1 displays the intensities of Raman peaks of PET fibers treated with sodium hydroxide, sulfuric acid, copper sulfate. The intensities of Raman peaks of PET fibers treated with sodium hydroxide and copper sulfate increase, whereas the intensities of Raman peaks of PET fibers treated with sulfuric acid decrease significantly, suggesting that the molecular vibration modes of PET fibers are enhanced after being treated with sodium hydroxide, copper sulfate and, in contrast, the molecular vibration modes of PET fibers are suppressed greatly after being treated with sulfuric acid.
Table 1 Intensities of Raman peaks under different conditions
表1 不同方法处理后的拉曼峰强度
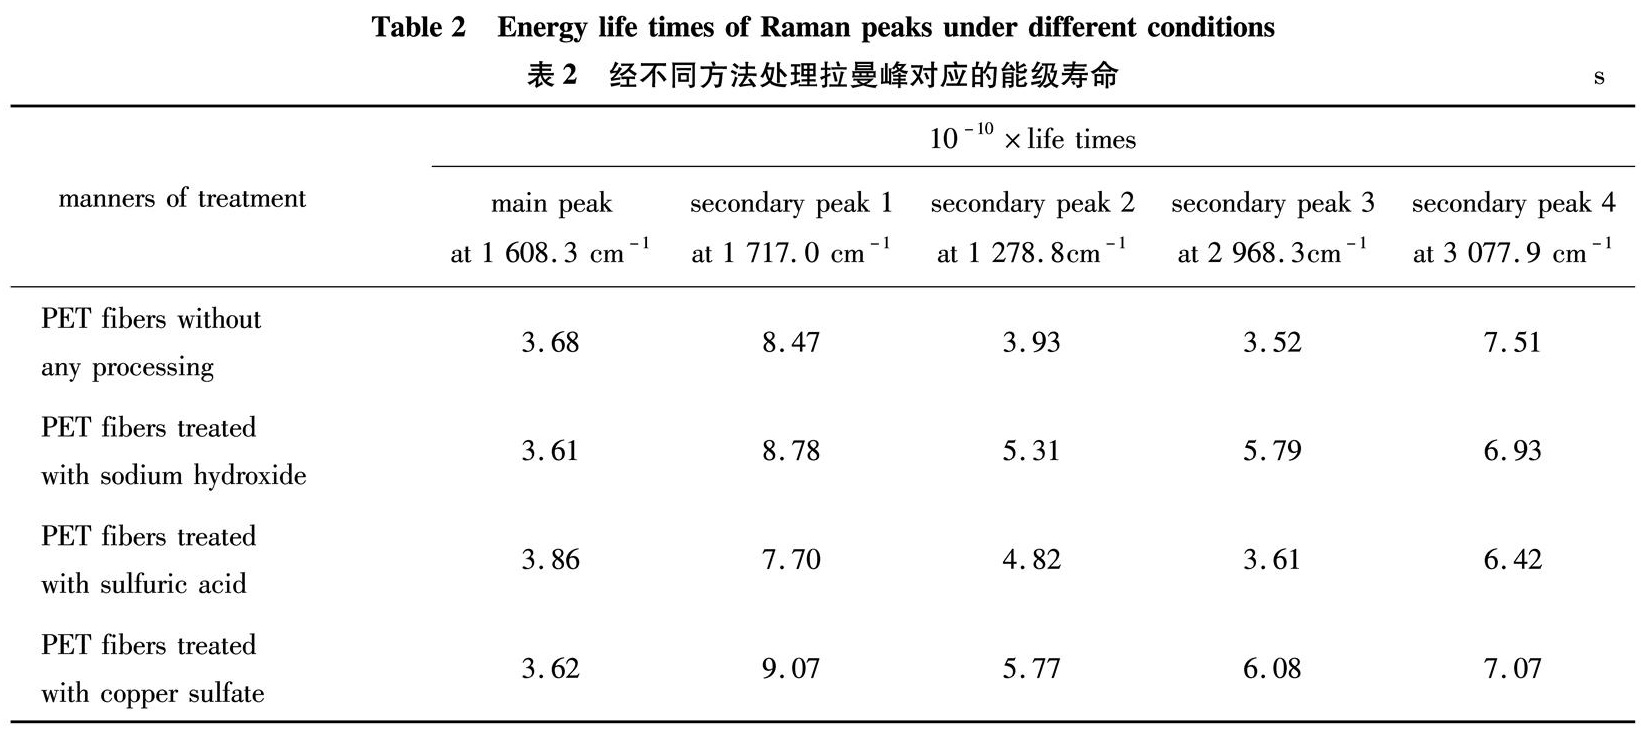
On the other hand, different conditions also have different effects on the lifetimes of vibration modes of PET molecules. The lifetimes of vibration modes can be calculated according to[18]
ΔνΔτ=1(1)
where Δν denotes the frequency bandwidth of the spectrum(full width at half maximum), Δτ denotes the lifetime. Table 2 exhibits lifetimes of vibration modes of PET fibers treated with sodium hydroxide, sulfuric acid and copper sulfate. One can find that, the lifetimes of the vibration modes corresponding to 1 608.3 and 1 717.0 cm-1 change slightly for PET fibers treated with sodium hydroxide, sulfuric acid and copper sulfate, indicating that these two vibration modes are not sensitive to the reaction of PET fibers with sodium hydroxide, sulfuric acid and copper sulfate. In contrast, the lifetimes of the vibration modes corresponding to 1 278.8, 2 968.3 and 3 077.9 cm-1 have relatively distinct changes, indicating that these three vibration modes are more sensitive to the reaction of PET fibers with sodium hydroxide, sulfuric acid and copper sulfate than the aforementioned two vibration modes.
Table 2 Energy life times of Raman peaks under different conditions
表2 经不同方法处理拉曼峰对应的能级寿命
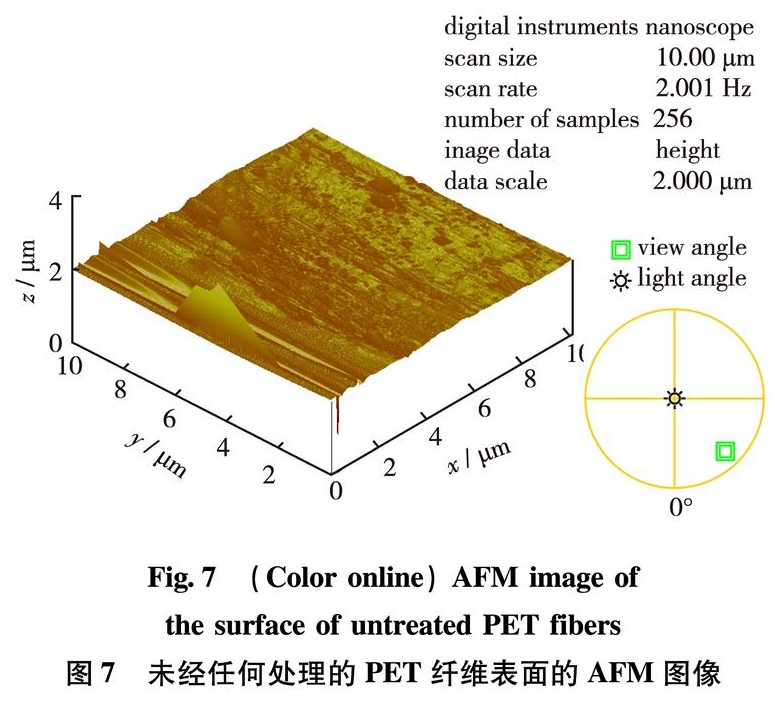
2.2 AFM image of PET fibers
The influences of sodium hydroxide, sulfuric acid and copper sulfate on chemical bonds and molecular structures of PET fibers have been investigated using AFM, and the AFM images of PET fibers under different treatment are shown in Fig.7—Fig.10.
Fig.7 (Color online)AFM image of the surface of untreated PET fibers
图7 未经任何处理的PET纤维表面的AFM图像
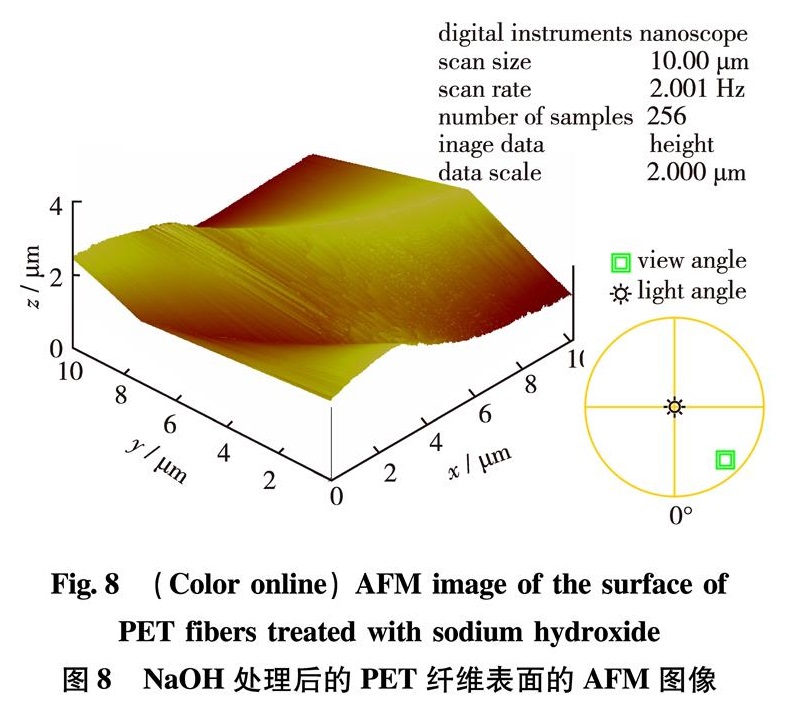
Fig.8 (Color online)AFM image of the surface of PET fibers treated with sodium hydroxide
图8 NaOH处理后的PET纤维表面的AFM图像
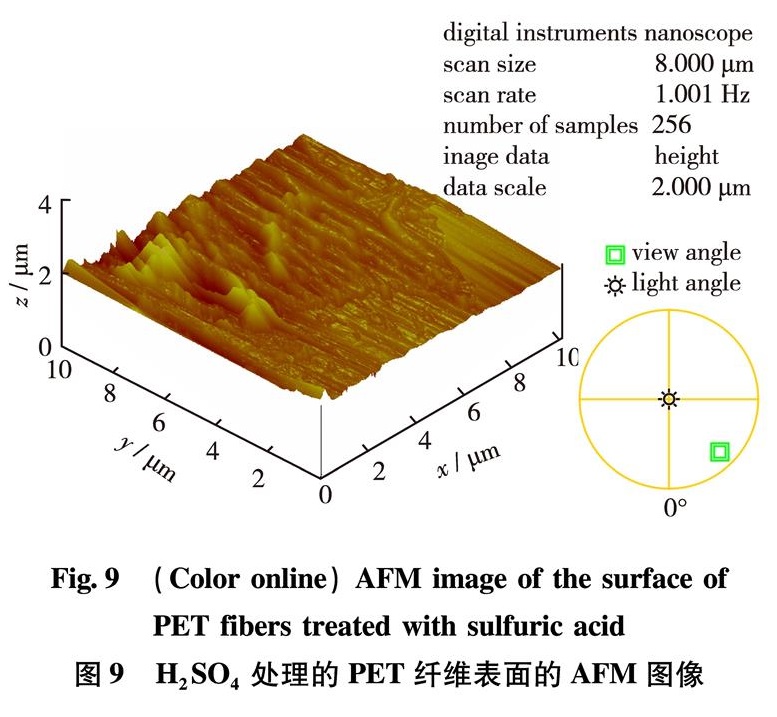
Fig.9 (Color online)AFM image of the surface of PET fibers treated with sulfuric acid
图9 H
2SO
4处理的PET纤维表面的AFM图像
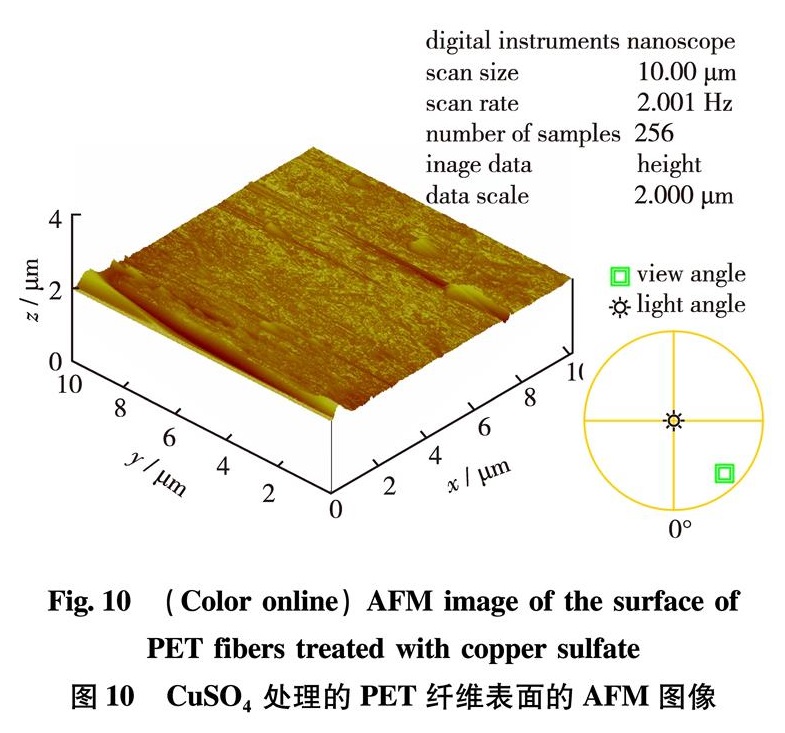
Fig.10 (Color online)AFM image of the surface of PET fibers treated with copper sulfate
图10 CuSO
4处理的PET纤维表面的AFM图像
Comparing Fig.7 with Fig.8, it can be seen that the roughness of the surface of untreated PET fibers is much smaller as compared to that of PET fibers treated with sodium hydroxide. Since Raman spectrum intensity increases with the roughness of fiber surface, the result obtained by AFM is consistent with the result acquired by Raman spectroscopy(see Fig.4). One can see from Fig.9 that the surface of PET fibers treated with sulfuric acid is much smoother compared with Fig.7, leading to the result that the intensities of Raman peaks of PET fibers treated with sulfuric acid decrease notably. Similar to Fig.8, Fig.10 shows that the surface roughness of PET fibers treated with copper sulfate is increased compared to that of untreated PET fibers, which is responsible for the higher intensities of Raman peaks produced by PET fibers treated with copper sulfate.